This simple observability stack helped us understand where our backend was silently struggling.
When you’re building backend services with NestJS, one of the first things you’ll notice is this:
🧱 Out of the box, there’s no observability, just logs.
But logs alone don’t tell you how your service behaves under load, or why requests are slowing down.
So here’s what we did:
🔍 What I was trying to answer
How can we measure request latency and trace slowdowns per endpoint in our NestJS backend?
🛠️ Tool used:
– nestjs-otel by @pragmaticivan
– Prometheus for metrics
– Loki for logs
– Tempo for tracing
– Grafana for visualization & alerting
💡 What I found
With just a bit of setup:
– We were able to auto-inject span and trace IDs into structured logs (we use Pino)
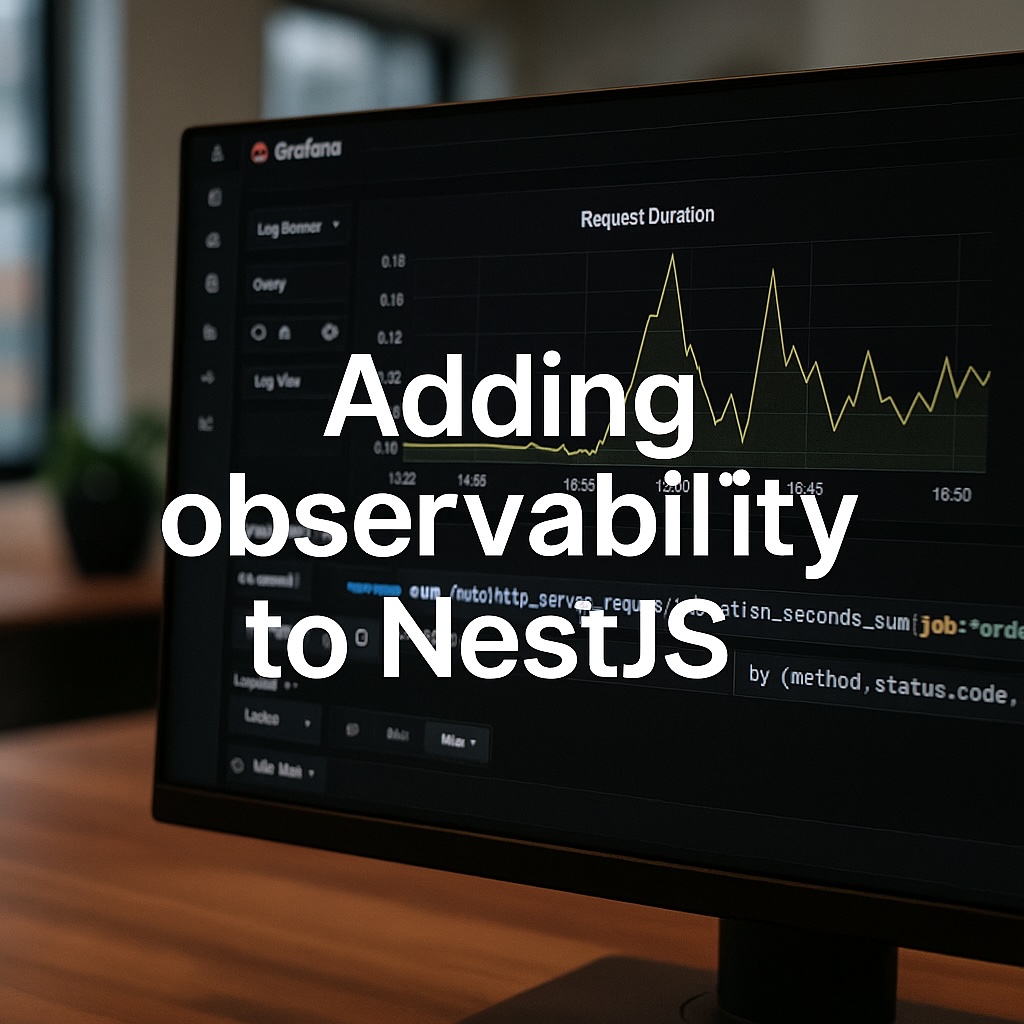
– Every backend request was measured and exported as Prometheus metrics
– Latency per endpoint became easy to chart
– Slow endpoints stood out clearly on Grafana dashboards
🚨 Impact
Now we:
– Get alerts if latency crosses SLA thresholds
– Can debug with full trace → from request → logs → metrics → alerts
– Spend less time wondering what went wrong and more time fixing it
If you’re using NestJS (or planning to), consider integrating observability early.
It saves engineering hours, improves uptime, and boosts team confidence during incidents.
If you’re working with metrics and want dev-focused insights, I’m happy to brainstorm.
Let’s connect. 🚀